Predicting citation rates for arXiv astrophysics papers
I have been looking for an excuse to try out the Python Natural Language Toolkit, and thought that it would be most useful if I applied it to something close to home. Inspired by the recent brilliance that is @OverheardOnAph, I decided I would look at the same corpus of text (the astrophysics arXiv), but with a different goal in mind. Instead of parsing the raw LaTeX files for comments that the authors probably intended to remove before publishing, I asked: are there any features of a paper's abstract that predict how well it will be cited down the road?
I found some very intriguing results:
- Papers with long, non-repetitive abstracts are substantially more likely to be well-cited than papers with short or repetitive abstracts.
- Each additional five unique words increments the median citations after five years by one.
- Papers submitted to the general astro-ph are the most cited, followed by astro-ph.CO, astro-ph.GA, astro-ph.HE, astro-ph.SR, astro-ph.EP, and astro-ph.IM.
- After controlling for length and sub-arxiv, papers with abstracts written mostly in passive voice are penalized slightly relative to papers with abstracts written mostly in active voice.
- For some sub-arXivs, there are individual words that appear significantly more often in well-cited papers' abstracts than poorly-cited ones. These words are:
- In astro-ph.HE:
- "100"
- "GeV"
- In astro-ph.EP:
- "star"
- In the general astro-ph:
- "abridged" (further evidence that longer abstracts are better cited)
- "galaxy" or "galaxies"
- "lcdm"
- "massive"
- "scale"
- In astro-ph.HE:
- No individual words were found that predicted poor citation rates.
Read on for details!
The sample
I collected 4,575 abstracts of astrophysics papers published in 2009 using the arXiv API, and used their DOI or arXiv ID to locate their associated NASA ADS page, which I then parsed using BeautifulSoup to extract their current citation count (citations after 5 years).
I only extracted the abstracts of papers that included journal references. This is a fairly small fraction of the total number of papers, but it allowed me to ensure that the articles were (a) published in a journal and (b) published in 2009.
I retained each paper's citation count, raw abstract text, and the primary arXiv category the paper was listed under (astro-ph, astro-ph.CO, astro-ph.EP, etc.)
Text analysis
I checked a number of properties of abstracts for correlations with citation rate. When searching for correlations, I was most interested in how the median citation rate varied with the properties under consideration. For initial inspection, I usually broke up the sample into N groups with equal population, sorted on the property of interest, and compared the median citation rates of each of these groups. I estimated the uncertainty in these medians due to finite sample size by a simple bootstrap analysis; resampling with replacement the citation counts in each group and calculating a large sample of medians that "might have been," then determining the confidence interval on the true median from the distribution of medians within this sample.
Using this approach, I found no obvious trends with reading level (using either SMOG grade or Flesch–Kincaid Grade Level) or fraction of text written in passive voice (the passive-voice heuristic I developed is incorporated in my open-source NLTK Jargon package).
I did, however, find one property that strongly correlated with median citation rate: abstract length. The strongest correlation I identified was between citation count and the total number of unique word roots in an abstract.
Papers with long, detailed abstracts are substantially better-cited than papers with short abstracts
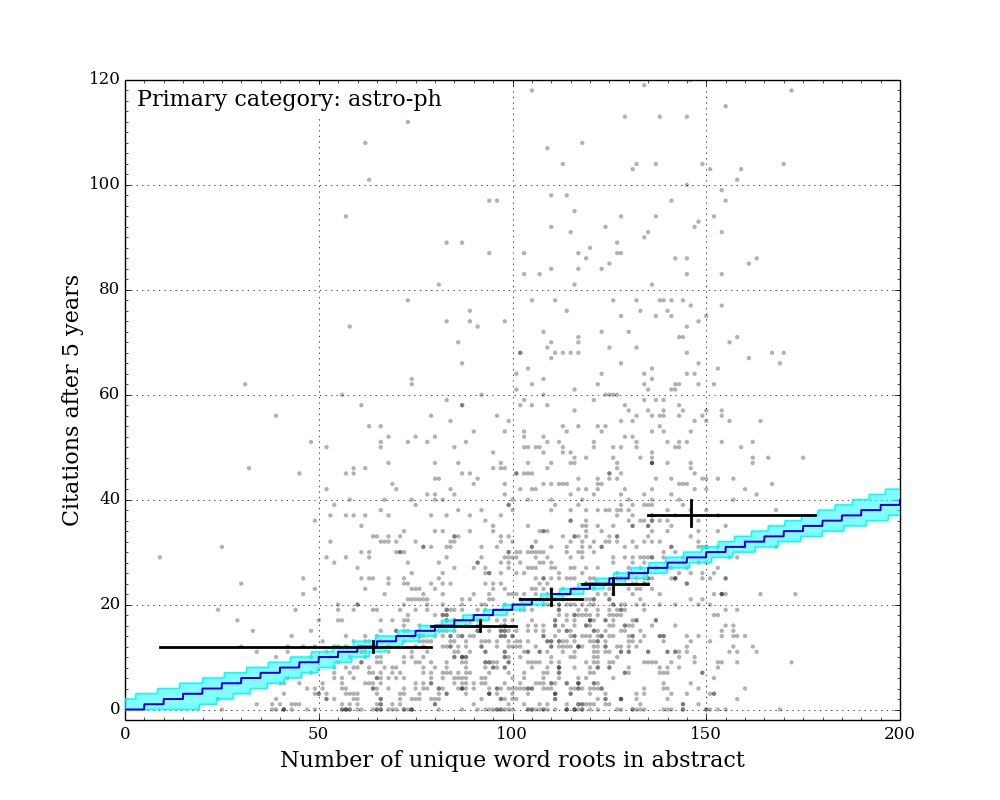
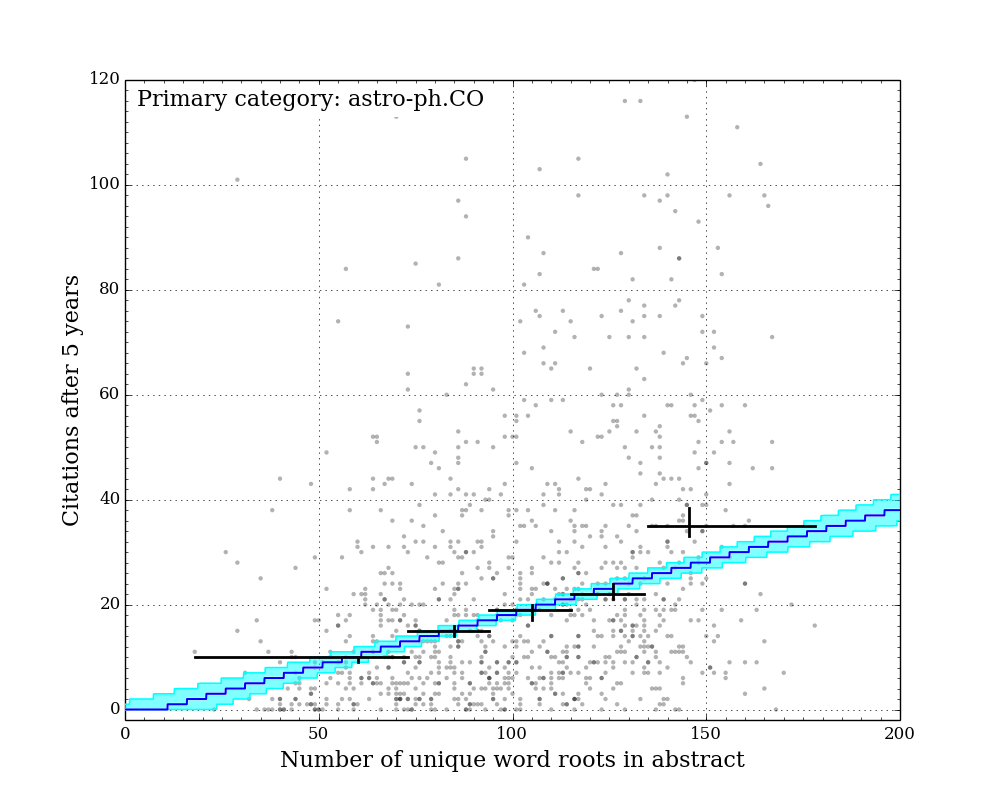
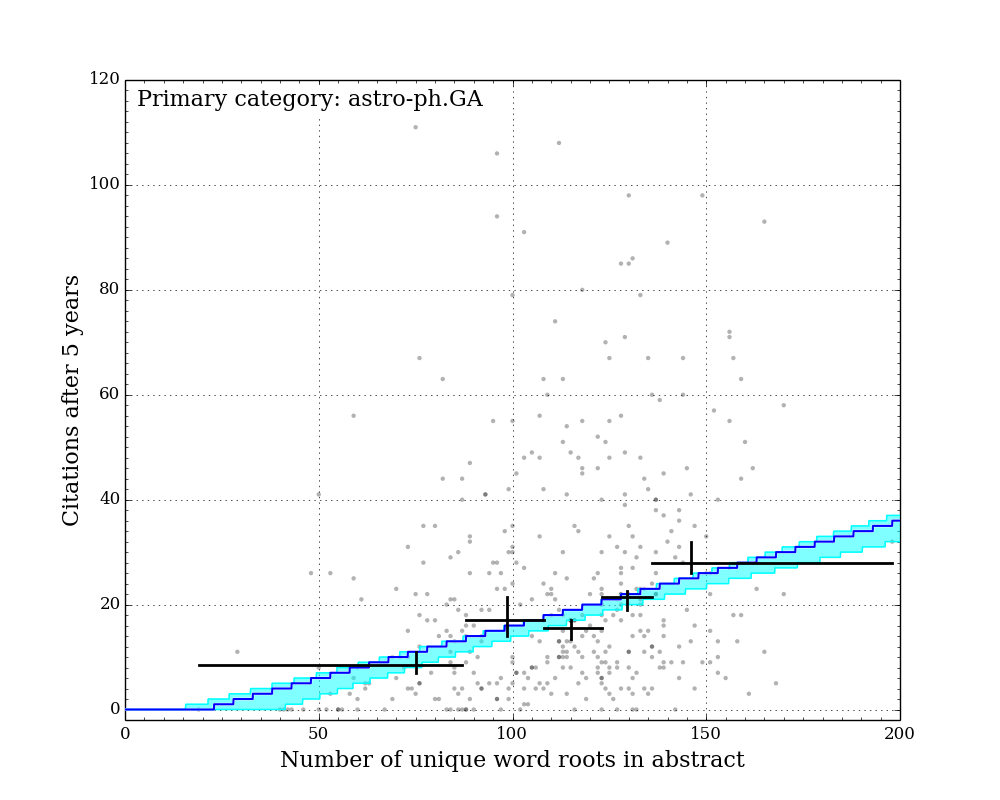
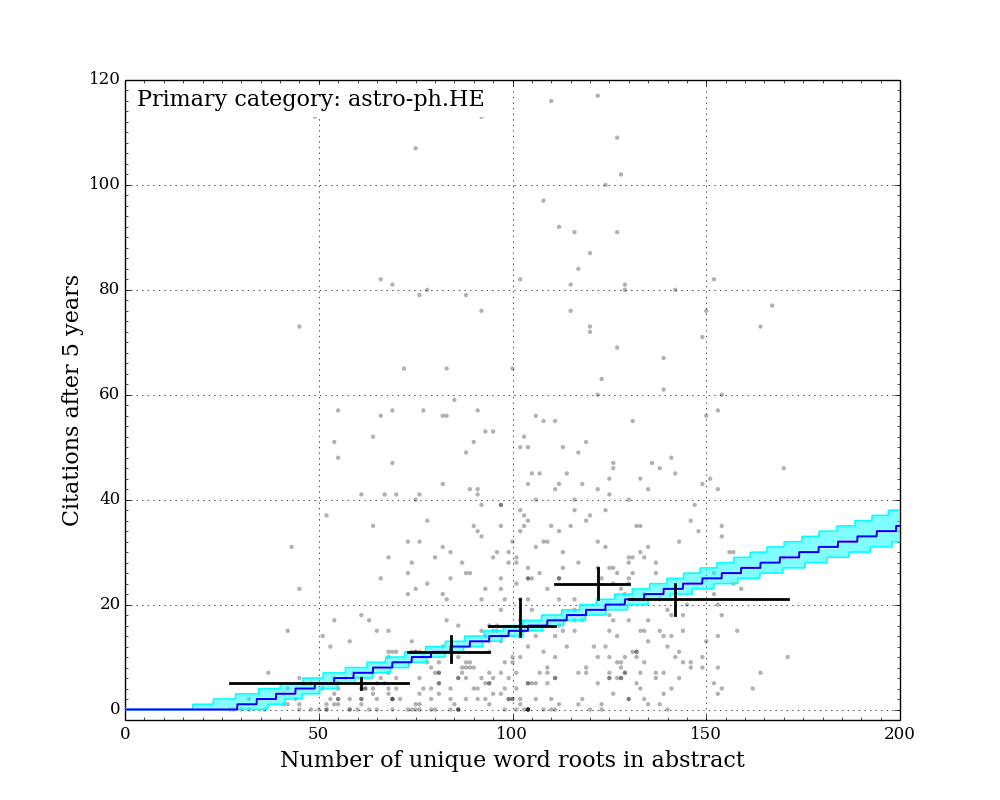
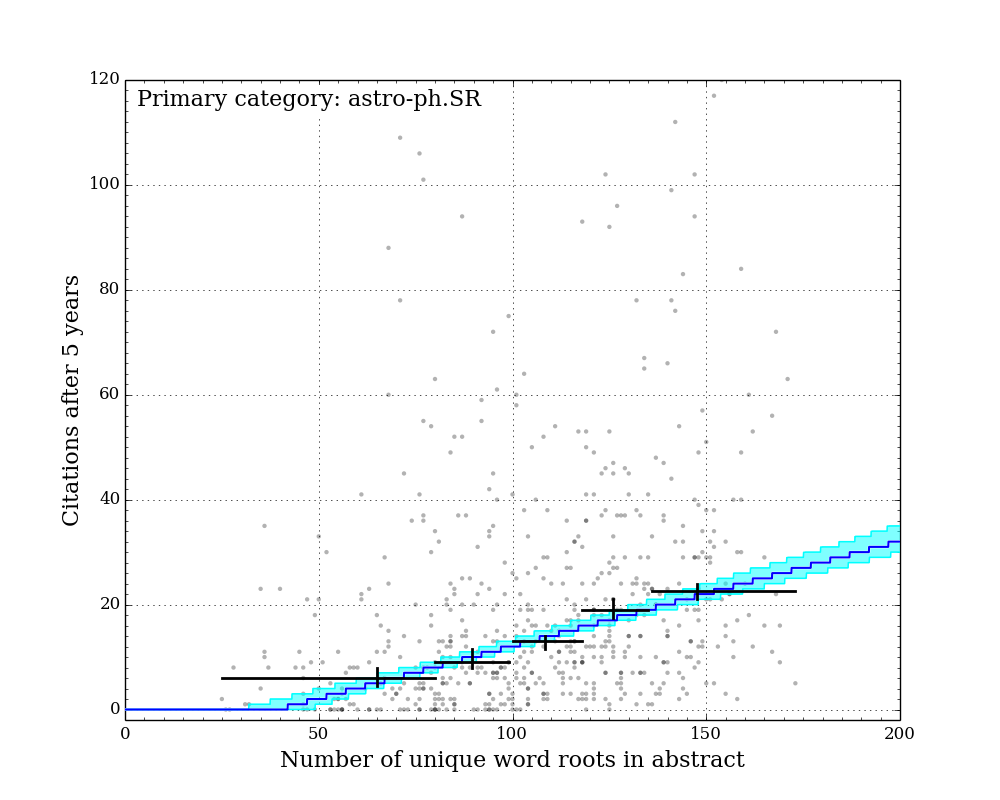
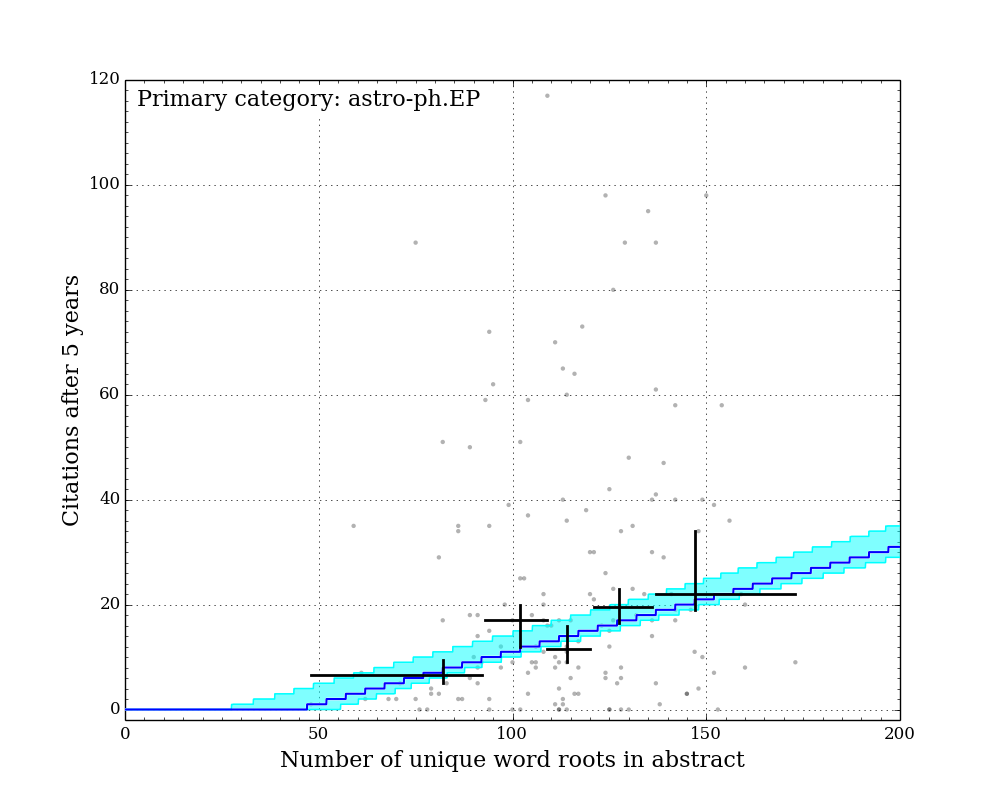

Figure Gallery 1: Citations after 5 years vs. number of unique word roots. 7 sub-arxivs illustrated separately. Black crosses: equal-population grouped medians with 1-sigma sampling uncertainty illustrated by vertical lines. Blue line: best-fit "linear median" model with constant slope across all sub-arxivs. Cyan region: 1-sigma credible region of "linear median" model.
The figures above show the citations after five years vs. the number of unique word roots in each paper abstract. I split the papers into their primary sub-arxiv for these figures. Overlaid on the points are 5 grouped medians (black crosses), each representing equal populations sorted on number of unique word roots. The horizontal bars illustrate the range covered by each population, and the vertical error bars illustrate the 1-sigma uncertainty on the medians determined by the bootstrap resampling described earlier.
Qualitatively, it is clear that for all categories, the median citation rate climbs as the number of unique words in the abstract increases. In order to better quantify this, I adopted a linear model for the expected median citation rate as a function of number of unique word roots. Below where this model intersects zero, the model citation rate is set to zero.
Because some sub-arxivs are poorly represented in my sample, I decided to fix the slope of this model across all sub-arxivs, while allowing the constant factor to vary for each sub-arxiv. This effectively implies an assumption that while there may be fewer citations to a paper in a given sub-arxiv, the addition of more unique word roots (or more information) is equally valued across all sub-arxivs.
Since there are an infinite number of lines that bisect a given 2D distribution exactly in half, the definition of a formal "linear median trendline" is subtle. Because both quantities under consideration here are discretized, it is possible to construct a relatively simple and formally meaningful median trendline definition that does not rely on any additional binning of the data. I hope to describe this median trendline definition in a future post. Note that the grouped medians illustrated by the black crosses in the figures above do not have any influence on the model, and yet they generally agree very well with the model (except for astro-ph.IM, which is an outlier in a number of ways...).
I determined the uncertainties on the linear median model parameters (one slope M and seven intercepts {b1 ... b7}) with a bootstrap-resampling approach: I resample with replacement from the abstracts' citations and length in each sub-arxiv, re-fit the "linear median trendline" model to the resampled data, and repeat this process many times. The posterior distribution of the parameters of the model are estimated from the distribution of the models fit to the resampled data.
The best-fit slope and its 1-sigma uncertainty across all sub-arxivs is 0.20 (+0.03/-0.02). This indicates that for abstracts longer than some minimum length, each five additional unique word roots adds roughly one citation to the expected median citations after five years.
Using the constant terms of the linear median models, I ranked the absolute citation offsets between sub-arxivs. These offsets represent the median difference in citations accumulated after 5 years for two papers with otherwise identical abstract properties. The offsets are normalized to the general astro-ph repository, which has the highest median citation rate.
| sub-arxiv | Model median citation offset (uncertainty) |
|---|---|
| astro-ph | 0.0 (+0.0/-0.0) citations |
| astro-ph.CO | -1.2 (+1.3/-1.0) citations |
| astro-ph.GA | -3.6 (+0.4/-2.2) citations |
| astro-ph.HE | -4.8 (+1.6/-0.9) citations |
| astro-ph.SR | -7.4 (+1.4/-0.8) citations |
| astro-ph.EP | -8.4 (+3.4/-1.2) citations |
| astro-ph.IM | -13.2 (+1.1/-1.3) citations |
Papers with abstracts written in passive voice are slightly more likely to have below-median citation rates.
Given the best-fit linear median model for each sub-arxiv, I can determine if any paper falls above its predicted median citation rate or below it (given the number of unique word roots in its abstract). Controlling for the abstract length in this way, I re-inspected the other abstract properties to see if any others had any second-order influence on the citation rate. I found that papers written largely in passive voice were more likely to fall below their predicted median citation rate (given their abstract length) than papers written largely in active voice. This "passive voice penalty" is roughly a 10% effect.

Figure 2: Fraction of papers with citations above their predicted median citation rate, given their abstract length, as a function of the fraction of their abstracts' sentences that are written in active voice, illustrated in five equal-population groups. 1-sigma sampling uncertainty illustrated by cyan regions.
Some individual words appear more often in highly-cited papers' abstracts
I searched for words that appeared in multiple abstracts, and for each word counted the number of abstracts that contained that word which had more than the median citation count for abstracts of that length, and the number with fewer citations. I treated these two numbers as the outcome of a binomial process and assessed the likelihood that each word's pair of "highly cited" (>median) and "poorly cited" (<median) outcomes was consistent with chance given fair odds. Because I was checking many (N) unique words, each with different rates of occurrence across the sample of abstracts, I had to correct this estimate of statistical significance for the number of trials I performed. I achieved this with many Monte Carlo simulations of N fair (p=0.5) binomial processes with the same distribution of occurrence rates as the real words, and determined the probability of a given binomial test significance appearing for one word out of the sample of size N (assuming that all words are fair). I adopted this probability as the likelihood that a given word is "fair" (the null hypothesis).
There are several words for some sub-arXivs that are very likely not fair. Instead, papers with abstracts that contain these words are statistically significantly more likely to have higher-than-median citation rates compared to abstracts that do not.
These positively-biased words are listed for each sub-arxiv below.
For astro-ph (general):
| Word | p | N above median citations | N equal median citations | N below median citations |
|---|---|---|---|---|
| abridged | less than 0.1% | 60 | 3 | 12 |
| galax- | 0.1% | 286 | 8 | 182 |
| lcdm | 0.2% | 23 | 1 | 1 |
| massive | 4% | 123 | 3 | 66 |
| scale | 5% | 224 | 9 | 146 |
For astro-ph.HE:
| Word | p | N above median citations | N equal median citations | N below median citations |
|---|---|---|---|---|
| "100" | 1% | 39 | 0 | 10 |
| GeV | 5% | 53 | 0 | 23 |
For astro-ph.EP:
| Word | p | N above median citations | N equal median citations | N below median citations |
|---|---|---|---|---|
| star | 5% | 36 | 2 | 11 |
I identified no words that were negatively biased to a statistically significant degree.
The fact that the word "abridged" appears far more frequently in highly-cited abstracts than it does in poorly cited ones is a nice independent confirmation that long, detailed abstracts are generally better-cited than shorter ones.
Summary
All of the work above illustrates strong correlations between properties of paper abstracts and their median citation rates after five years. However, the causative link is not clear. It could well be that long, detailed abstracts written in active voice are generally linked to detailed, well-written papers, and that writing a long, detailed, active-voice abstract would do nothing to help an otherwise poor paper.
That being said, I can think of no reason to encourage authors to write short or repetitive abstracts entirely in the passive voice.